アメリカ合衆国United States of America
地図:外務省 https://www.mofa.go.jp/mofaj/area/usa/ より
| アメリカ | 日本 | |
|---|---|---|
| 人口(児童人口) | 3億3,812万(7,333万) (2023)Child Maltreatment 2023 |
1億2,435万(1,742万) (2023)総務省統計局 |
| 首都と人口(児童人口) | ワシントンD.C.68万(13万) (2023) Child Maltreatment 2023 |
1,326万(181万) (2023)東京都 |
目次
※ 1年間の始期日と終了日はそれぞれ10月1日と9月30日。例えば2023年は2022年10月1日から2023年9月30日を示す。
1.通告
表1-1.通報件数、及び通告として受理された通報件数の推移(2019~2023年)
| 2019 | 2020 | 2021 | 2022 | 2023 | |
|---|---|---|---|---|---|
| 児童人口(全52州) | 73,661,476 | 74,823,584 | 74,175,203 | 73,743,251 | 73,330,540 |
| 全通報数(推計) | 4,395,000 | 3,987,000 | 4,002,000 | 4,276,000 | 4,399,000 |
| 児童1,000人あたり(推計) | 59.7 | 53.3 | 54.0 | 58.0 | 60.0 |
| 全受理通報数(通告数) | 2,383,411 | 2,123,934 | 2,045,884 | 2,120,290 | 2,107,473 |
| 児童1,000人あたり | 32.4 | 28.4 | 27.6 | 28.8 | 28.7 |
全通報数(推計)は、受理された通報数(screened-in)と受理されなかった通報数(screened-out)の全米推計値を合計したものである。児童1,000人あたりの値は四捨五入されている。
出典:U.S. Department of Health & Human Services, Administration for Children and Families, Administration on Children, Youth and Families & Children’s Bureau.(2025). Child Maltreatment 2023.
図1-1. 受理された通告についての通告者の割合(2023年)
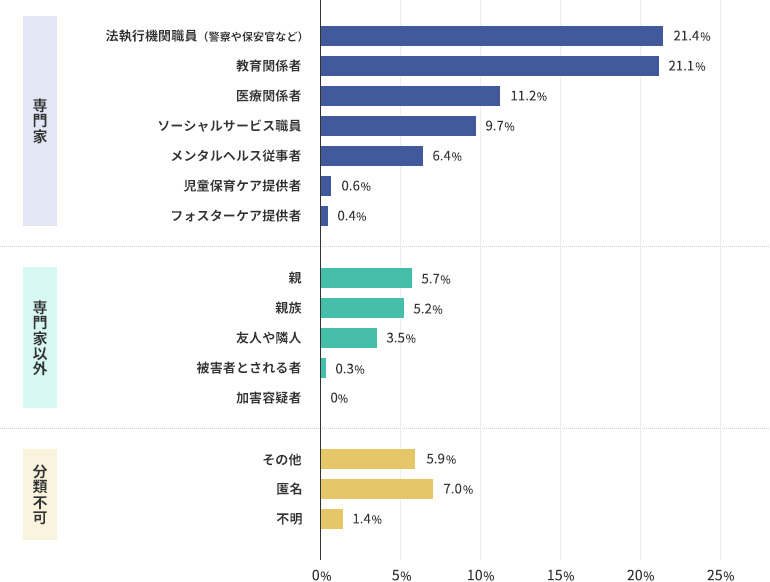
51州の報告データに基づく。
出典:U.S. Department of Health & Human Services, Administration for Children and Families, Administration on Children, Youth and Families & Children’s Bureau. (2025). Child Maltreatment 2023.
2.調査・アセスメント
表2-1.調査・代替対応(家族アセスメント)を受けた児童(2019~2023年)
| 2019 | 2020 | 2021 | 2022 | 2023 | |
|---|---|---|---|---|---|
| 調査または代替対応を 受けた児童数 |
3,500,991 | 3,151,631 | 3,027,428 | 3,113,181 | 3,081,715 |
| 児童1,000 人あたり | 47.5 | 42.1 | 40.8 | 42.2 | 42.0 |
出典:U.S. Department of Health & Human Services, Administration for Children and Families, Administration on Children, Youth and Families & Children’s Bureau.(2025). Child Maltreatment 2023.
3.虐待の被害児童
表 3-1.虐待の被害が認定された、または虐待の可能性があると判断された児童(被害児童)の数の推移(2019~2023年)
| 2019 | 2020 | 2021 | 2022 | 2023 | |
|---|---|---|---|---|---|
| 被害児童数 | 677,099 | 619,480 | 599,666 | 558,088 | 546,159 |
| 児童 1,000 人あたり | 9.2 | 8.3 | 8.1 | 7.6 | 7.4 |
出典:U.S. Department of Health & Human Services, Administration for Children and Families, Administration on Children, Youth and Families & Children’s Bureau.(2025). Child Maltreatment 2023.
表 3-2.被害児童が受けた虐待の類型(2023年)
| 虐待の類型 | 報告州 | 被害を受けた 児童の数* | 全被害児童における割合(%) |
|---|---|---|---|
| 医療ネグレクト | 39 | 4,782 | 0.8 |
| ネグレクト | 52 | 377,742 | 64.1 |
| その他の虐待 | 22 | 12,453 | 2.1 |
| 身体的虐待 | 52 | 62,685 | 10.6 |
| 心理的マルトリートメント(心理的虐待) | 46 | 20,895 | 3.5 |
| 性的虐待 | 52 | 44,355 | 7.5 |
| 性的人身売買 | 33 | 800 | 0.1 |
| 不明 | 3 | 307 | 0.1 |
| 多重虐待 | 52 | 65,496 | 11.1 |
| 被害児童数 | 52 | 589,515 | – |
*児童1人が受けた虐待の種別をすべて数えている。
出典:U.S. Department of Health & Human Services, Administration for Children and Families, Administration on Children, Youth and Families & Children’s Bureau.(2025). Child Maltreatment 2023.
表 3-3.被害児童の養育者の主なリスク要因(2023年)
| リスク要因 | 報告州 | 報告州の 被害児童数 |
養育者にリスク要因がある 被害児童の数 |
報告州の 被害児童総数における割合(%) |
|---|---|---|---|---|
| アルコールの乱用 | 34 | 359,549 | 58,242 | 16.2 |
| DV | 38 | 430,844 | 108,112 | 25.1 |
| 薬物の乱用 | 40 | 427,348 | 106,594 | 24.9 |
| 住環境の問題 | 38 | 395,143 | 29,874 | 7.6 |
出典:U.S. Department of Health & Human Services, Administration for Children and Families, Administration on Children, Youth and Families & Children’s Bureau.(2025). Child Maltreatment 2023.
表3-4. 加害者の被害児童との関係(2023年)(49州)
| 加害者 | 被害者数 | 加害者数 | 割合(%) | |
|---|---|---|---|---|
| 親 | 父親のみ | ー | 125,493 | 24.6 |
| 父親と親以外の人物 | ー | 5,416 | 1.1 | |
| 母親のみ | ー | 189,635 | 37.2 | |
| 母親と親以外の人物 | ー | 27,898 | 5.5 | |
| 2人の親(性別不明) | ー | 99,051 | 19.4 | |
| 3人の親(性別不明) | ー | 758 | 0.1 | |
| 2人の親(性別不明)と親以外の人物 | ー | 4,156 | 0.8 | |
| 1人または複数の親(性別不明) | ー | 1,280 | 0.3 | |
| 親合計 | ー | 453,687 | 89 | |
| 親以外 | 保育提供者 | ー | 2,048 | 0.4 |
| 里親 | ー | 1,792 | 0.4 | |
| 友人・隣人 | ー | 3,739 | 0.7 | |
| グループホーム・入所施設スタッフ | ー | 1,029 | 0.2 | |
| 法定後見人 | ー | 1,650 | 0.3 | |
| その他専門家 | ー | 1,763 | 0.3 | |
| 親戚 | ー | 28,073 | 5.5 | |
| 未婚のパートナーまたは親 | ー | 17,787 | 3.5 | |
| その他 | ー | 16,604 | 3.3 | |
| 複数の親以外の加害者 | ー | 2,229 | 0.4 | |
| 親以外合計 | ー | 76,714 | 15.1 | |
| 不明合計 | ー | 20,114 | 3.9 | |
| 49州合計 | 509,710 | 550,515 | 108 | |
出典:U.S. Department of Health & Human Services, Administration for Children and Families, Administration on Children, Youth and Families & Children’s Bureau.(2025). Child Maltreatment 2023.
4.フォスターケアを受けた児童
表 4-1.フォスターケアを受けた児童数の推移(2020~2024年)
| 2020 | 2021 | 2022 | 2023 | 2024 | |
|---|---|---|---|---|---|
| フォスターケア下の児童数 (9月30日現在) |
407,332 | 391,641 | 368,530 | 340,050 | 328,947 |
| 新たにフォスターケアと なった児童数 |
216,450 | 206,867 | 186,602 | 174,112 | 170,943 |
| フォスターケアが解除と なった児童数 |
223,918 | 214,542 | 201,372 | 184,018 | 176,730 |
| フォスターケアを経験した 児童数 |
631,192 | 606,145 | 569,879 | 524,077 | 505,682 |
出典:U.S. Department of Health and Human Services, Administration for Children and Families, Administration on Children, Youth and Families, Children’s Bureau. The AFCARS Dashboard. Preliminary FFY1 2024 Estimates as of September 5, 2025 – No. 32.
表 4-2.フォスターケアとなった児童の生活の場所(2024年9月30日現在)
| 里親家庭 | 親戚関係のない里親 | 92,808 | 28% |
|---|---|---|---|
| 養子縁組前の里親 | 10,513 | 3% | |
| 親族またはキンシップ里親 | 127,449 | 39% | |
| 緊急・一時・暫定保護里親 | 1,166 | 0% | |
| 治療的里親 | 28,365 | 9% | |
| グループホーム | 13,234 | 6% | |
| SV付きで自立 | 12,200 | 4% | |
| 施設 | 7,555 | 2% | |
| 少年司法施設 | 2,111 | 1% | |
| 親元または法的後見人と同居 | 12,637 | 4% | |
| レジデンシャルケア* | 14,541 | 4% | |
| 家出中 | 2,814 | 1% | |
| 行方不明 (家出とみなされないケース) |
1,484 | 0% | |
| データなし | 2,070 | 1% | |
| 児童数合計 | 328,947 | ||
*レジデンシャルケア:メンタルヘルスや行動上の課題がある子どもの治療を目的とする施設
出典:U.S. Department of Health and Human Services, Administration for Children and Families, Administration on Children, Youth and Families, Children’s Bureau. The AFCARS Dashboard. Preliminary FFY1 2024 Estimates as of September 5, 2025 – No. 32.
5.虐待による児童の死亡件数
虐待による児童の死亡件数は、各州のCPS(児童保護機関)が「虐待・ネグレクトによる死亡」と判断した件数である。全米児童虐待・ネグレクトデータシステム(National Child Abuse and Neglect Data System:NCANDS)が集計し、アメリカ合衆国保健福祉省(U.S. Department of Health & Human Services)の児童局(Children’s Bureau)が報告書としてとりまとめている。
表 5-1.虐待による児童の死亡件数(2019~2023年)
| 2019 | 2020 | 2021 | 2022 | 2023 | |
|---|---|---|---|---|---|
| 報告州 | 52 | 52 | 52 | 51 | 51 |
| 虐待による死亡件数 | 1,825 | 1,832 | 1,888 | 2,010 | 1,968 |
| 児童10万人あたり | 2.48 | 2.45 | 2.55 | 2.78 | 2.73 |
| 死亡件数の全国推計 | 1,825 | 1,832 | 1,888 | 2,050 | 2,000 |
出典:U.S. Department of Health & Human Services, Administration for Children and Families, Administration on Children, Youth and Families & Children’s Bureau.(2025). Child Maltreatment 2023.
表 5-2.死亡事例における虐待の類型(2023年)(46州)
| 死亡事例数 | 虐待類型* | 事例数における割合 | |
|---|---|---|---|
| 医療ネグレクト | – | 126 | 7.8% |
| ネグレクト | – | 1,252 | 78.0% |
| その他 | – | 1 | 0.1% |
| 身体的虐待 | – | 668 | 41.6% |
| 心理的マルトリートメント | – | 15 | 0.9% |
| 性的虐待 | – | 9 | 0.6% |
| 性的人身取引 | – | – | – |
| 不明 | – | – | – |
| 46州合計 | 1,606 | 2,071 | N/A |
*死亡した児童が受けていた虐待の類型をすべて数えている。
出典:U.S. Department of Health & Human Services, Administration for Children and Families, Administration on Children, Youth and Families & Children’s Bureau.(2025). Child Maltreatment 2023.